Singapore is one of the most air-conditioned countries on earth, and the data proving it sits scattered across a dozen government portals, a climate research centre, a utility company and a handful of market research firms. No one has put it in one place. This page does that.
Below are 133 verified statistics covering household ownership, electricity costs, the NEA rules that govern what you are allowed to buy and install, Singapore’s warming climate, the Go25 movement, district cooling, indoor air quality and consumer behaviour. Roughly four in five figures come from Singapore government sources. Where a number is global or regional, we label it. Where sources disagree, we show both. Where credible Singapore data does not exist, we say so instead of guessing.
Fast facts: the 12 numbers worth quoting
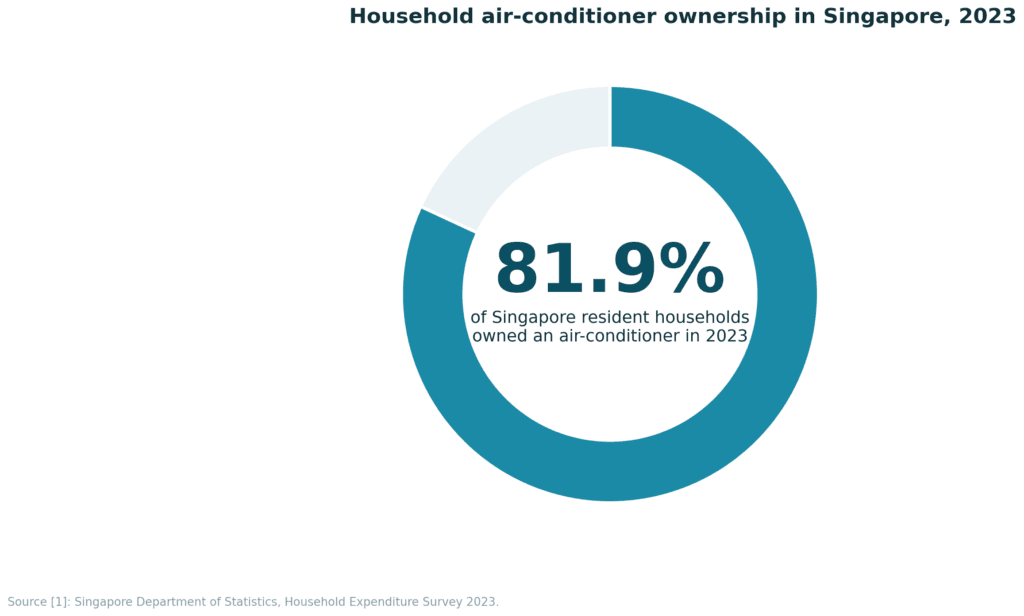
- 81.9% of Singapore resident households owned an air-conditioner in 2023, up from 2.7% in 1973. [1]
- Air-conditioning accounts for nearly a quarter of the average Singapore household’s energy consumption, and about half of the average building’s. [3]
- The regulated household electricity tariff hit 31.91 cents per kWh before GST in the third quarter of 2026, the highest on record. [4]
- Raising an office setpoint by one degree, from 23°C to 25°C, cuts cooling energy use by up to 12% per degree. [3]
- Singapore’s mean surface air temperature has risen 0.25°C per decade since 1948, roughly double the global rate. [5]
- Only 32.6% of households in HDB 1- and 2-room flats had an air-conditioner in 2023, against 97.8% in condominiums. [2]
- Singapore averaged 21.4 days a year above 35°C over the last 40 years. By 2100 that becomes 41 to 351 days. [6]
- Space cooling is the single largest energy consumer in Singapore buildings at 40% to 60% of a building’s energy use. [7]
- Singapore had 1,487,100 resident households in 2025, so an 81.9% ownership rate points to well over a million air-conditioned homes. [8][1]
- The Marina Bay network is the world’s largest underground district cooling network, heading to a total capacity of up to 90,000 refrigeration tons. [9]
- Since 1 October 2022, household split air-conditioners sold in Singapore must use a refrigerant with a global warming potential of 750 or lower, which is why R32 replaced R410A. [12]
- NEA’s energy label runs from 1 tick to 5 ticks, and its annual running cost figure assumes 8 hours of use a day. [11]
1. Ownership and market size
Air-conditioning went from a luxury to a default in one generation. The Household Expenditure Survey, run by the Singapore Department of Statistics, has tracked it since 1973.
- 2.7% of resident households owned an air-conditioner in 1973. [1]
- 11.2% owned one in 1983. [1]
- 19.4% owned one in 1988. [1]
- 35.3% owned one in 1993. [1]
- 58.3% owned one in 1998. [1]
- 71.2% owned one in 2003. [1]
- 74.7% owned one in 2008. [1]
- 76.1% owned one in 2012/13. [1]
- 79.7% owned one in 2017/18. [1]
- 81.9% owned one in 2023, the most recent survey. [1]
- That is a 30-fold increase in ownership across 50 years. [1]
- By dwelling type in 2023: landed properties 98.5%, condominiums and other apartments 97.8%, HDB 5-room and Executive 89.4%, HDB 4-room 82.3%, HDB 3-room 70.4%, HDB 1- and 2-room 32.6%. [2]
- Across all HDB flats, ownership was 77.3% in 2023, up from 71.2% in 2012/13. [2]
- Ownership in HDB 1- and 2-room flats rose from 13.5% in 2012/13 to 32.6% in 2023, the fastest growth of any dwelling type. [2]
- By income, the lowest 20% of households went from 52.1% in 2012/13 to 64.4% in 2023. [2]
- The top 20% of households were at 95.3% in 2023. [2]
- The middle quintile, the 41st to 60th percentile, was at 85.2% in 2023. [2]
- Singapore had 1,487,100 resident households in 2025, of which 1,148,000 were HDB dwellings. [8]
- HDB 1- and 2-room flats numbered 108,300 in 2025, up from 52,300 in 2010. [8]
- There were 1,623,242 residential dwelling units in Singapore in 2025. [23]
- HDB flats house about 80% of Singapore’s resident population, and about 90% of those residents own their homes. [20]
- TechSci Research valued the Singapore air conditioner market at USD 79.07 million in 2024, forecast to reach USD 104.49 million by 2030, a CAGR of 4.81%. [26]
- Expert Market Research puts the same market at USD 84.06 million in 2025, forecast to reach USD 135.63 million by 2035, a CAGR of 4.90%. [27]
Note on statistics 22 and 23: the two firms disagree on the base year value and on the growth rate. Both are private estimates with undisclosed methodologies. Treat the direction of travel, steady mid-single-digit growth, as the useful signal rather than the absolute dollar figure.
![Chart 2. Grouped horizontal bar. Ownership by dwelling type. Source [2].](https://www.vdairconservices.com/wp-content/uploads/2026/07/02_OWN1-1024x628.png)
Chart 2 data table
| Dwelling type | 2012/13 | 2023 |
|---|---|---|
| HDB 1- and 2-room | 13.5% | 32.6% |
| HDB 3-room | 57.8% | 70.4% |
| HDB 4-room | 75.9% | 82.3% |
| HDB 5-room and Executive | 87.9% | 89.4% |
| Condominiums and other apartments | 98.8% | 97.8% |
| Landed properties | 97.5% | 98.5% |
2. Electricity and the cost of running an aircon
This is the section most Singaporeans care about, because the tariff moves every quarter and the aircon is the biggest single load in the house.
- Air-conditioning makes up nearly a quarter of the average Singapore household’s energy consumption. [3]
- Air-conditioning makes up about half of the average building’s energy consumption. [3]
- Air-conditioner, refrigerator, lighting, water heater and washing machine together account for about 80% of energy use in a typical Singapore household. [14]
- The regulated household tariff for 1 July to 30 September 2026 is 31.91 cents per kWh before GST, or 34.78 cents per kWh with 9% GST. [16]
- That was a rise of 17.0%, or 4.64 cents per kWh, over the previous quarter. [4]
- SP Group put the increase at $17.14 a month before GST for the average family in an HDB four-room flat. [4]
- The energy cost component alone is 25.50 cents per kWh in the third quarter of 2026. Network costs add 6.10 cents, the Market Support Services fee 0.23 cents, and the Market Administration and Power System Operation fee 0.08 cents. [16]
- The tariff is set quarterly using average natural gas prices from the first two and a half months of the preceding quarter. [4]
- The lowest quarterly tariff in the last six years was 20.76 cents per kWh in the first quarter of 2021. [15]
- The tariff has therefore risen 53.7% from that 1Q 2021 low to the 3Q 2026 record. [15][4] (calculated from the two cited figures)
- The previous peak was 30.17 cents per kWh in the third quarter of 2022. [15]
- The tariff dipped to 26.71 cents per kWh in the first quarter of 2026 before the mid-year spike. [15]
- Households consumed 8 TWh of electricity in 2024, which is 14.6% of Singapore’s total. [13]
- Singapore’s total electricity consumption rose 4.0% to 58 TWh in 2024. [13]
- Commerce and services took the largest share at 40.2% in 2024, industry 39.4%, households 14.6% and transport 5.6%. [13]
- Private apartments and condominiums consume the most electricity of any housing type, followed by 4-room HDB flats, then 5-room flats and executive apartments. [14]
- NEA’s energy label calculates a model’s annual running cost using 27 cents per kWh and 8 hours of daily use, plus 16 hours of standby. [11]
![Chart 3. Line. Quarterly regulated household tariff in cents per kWh before GST. Sources [15] and [4].](https://www.vdairconservices.com/wp-content/uploads/2026/07/03_TAR1-1024x592.png)
Chart 3 data table (cents per kWh, before GST)
| Quarter | Tariff | Quarter | Tariff |
|---|---|---|---|
| 1Q 2021 | 20.76 | 1Q 2024 | 29.89 |
| 2Q 2021 | 22.55 | 2Q 2024 | 29.79 |
| 3Q 2021 | 23.38 | 3Q 2024 | 29.88 |
| 4Q 2021 | 24.11 | 4Q 2024 | 29.10 |
| 1Q 2022 | 25.44 | 1Q 2025 | 28.12 |
| 2Q 2022 | 27.94 | 2Q 2025 | 28.12 |
| 3Q 2022 | 30.17 | 3Q 2025 | 27.47 |
| 4Q 2022 | 29.74 | 4Q 2025 | 27.55 |
| 1Q 2023 | 28.95 | 1Q 2026 | 26.71 |
| 2Q 2023 | 27.43 | 2Q 2026 | 27.27 |
| 3Q 2023 | 27.74 | 3Q 2026 | 31.91 |
| 4Q 2023 | 28.70 |
Quarters to 2Q 2026 from SingStat [15]. 3Q 2026 from SP Group [4].
![Chart 4. Bar. Air-conditioning's share of energy use in households and buildings. Sources [3] and [7].](https://www.vdairconservices.com/wp-content/uploads/2026/07/04_COO1-1024x592.png)
3. Energy efficiency, MEPS and the 5-tick label
NEA regulates both the efficiency and the refrigerant of every household air-conditioner sold in Singapore. These are the current numbers.
- Every regulated household air-conditioner sold in Singapore carries an energy label rated from 1 tick (Low) to 5 ticks (Excellent). [11]
- Portable air-conditioners are rated only from 1 to 2 ticks, because their efficiency ceiling is far lower than a split system’s. [11]
- Minimum Energy Performance Standards for a single-split inverter unit require a weighted COP above 4.86 and standby power of 18 W or less. [10]
- A multi-split inverter unit must reach a weighted COP above 5.50. [10]
- Weighted COP is calculated as 0.4 × COP at 100% load plus 0.6 × COP at 50% load, which rewards part-load performance and therefore favours inverter compressors. [10]
- Casement and window units up to 8.8 kW must reach a COP of at least 3.78 at full load. [10]
- Single-phase portable air-conditioners with a single exhaust duct must reach a COP of at least 3.0. [10]
- Three-phase VRF systems must reach an Integrated Energy Efficiency Ratio of at least 4.35. [10]
- Energy labels must be 9 cm by 9 cm and affixed to the outdoor unit for split systems. [11]
- Advertisements for regulated goods must display the full energy label, or state the tick rating and Certificate of Registration number. [11]
- Eligible HDB and private households can claim $400 in Climate Vouchers, made up of $300 from 2024 and an additional $100 from 15 April 2025, valid until 31 December 2027. [24]
- Climate Vouchers are accepted at 180 participating retailers for energy- and water-efficient products. [24]
4. The refrigerant transition: R22, R410A and R32
The switch you see advertised as “R32 aircon” is not marketing. It is a legal requirement driven by global warming potential limits.
- Since 1 October 2022, single-phase non-ducted split air-conditioners up to 17.6 kW must use a refrigerant with a global warming potential of 750 or lower. R410A sits above that limit, which is why R32 became the default. [12]
- Household refrigerators up to 900 litres face a far stricter GWP limit of 15, in force since the same date. [12]
- Electrically driven water-cooled chillers of 1,055 kW or more also face a GWP limit of 15. [12]
- Centralised commercial refrigeration systems face a GWP limit of 150 from 1 July 2027. [12]
- Passenger car and light goods vehicle cabin air-conditioning faces a GWP limit of 150 from 1 July 2028. [12]
- Supplying non-compliant regulated goods carries a fine of up to $10,000 on conviction under the Environmental Protection and Management Act. [12]
- Carrying out regulated greenhouse gas works without a valid NEA registration carries a fine of up to $10,000, imprisonment of up to 3 months, or both. [12]
- Registered GHG entities that breach their obligations face fines of up to $20,000. [12]
- Companies must recover spent refrigerants with a GWP above 15 during decommissioning and send them to an NEA-authorised treatment facility. [12]
- To meet SCDF requirements for handling R32 systems, servicing personnel must complete the ITE Certificate of Competency in Residential Air-Conditioning System (Refrigerant). [12]
![Chart 5. Bar. Maximum permitted refrigerant GWP by equipment type, with effective dates. Source [12].](https://www.vdairconservices.com/wp-content/uploads/2026/07/05_SAV1-1024x493.png)
Chart 5 data table
| Regulated goods | GWP limit | In force from |
|---|---|---|
| Household split air-conditioners (≤17.6 kW) | 750 | 1 October 2022 |
| Household refrigerators (≤900 L) | 15 | 1 October 2022 |
| Water-cooled chillers (≥1,055 kW) | 15 | 1 October 2022 |
| Centralised commercial refrigeration | 150 | 1 July 2027 |
| Car and LGV cabin air-conditioning | 150 | 1 July 2028 |
5. Climate and heat: why demand keeps rising
Singapore is warming faster than the planet as a whole. This is the strongest evidence that cooling demand is structural, not cyclical.
- Singapore’s mean surface air temperature rose by an average of 0.25°C per decade between 1948 and 2025. [5]
- The global trend over 1951 to 2012 was 0.12°C per decade, so Singapore warmed at roughly double the global rate. (Global figure, labelled as such.) [5]
- 2024, 2019 and 2016 are tied as the warmest years on record, each with an annual mean of 28.4°C. [5]
- 2025 came in at 28.1°C, joint eighth warmest alongside 2010 and 2002. [5]
- Eight of the ten warmest years on record occurred in the 21st century, and all ten happened since 1997. [5]
- Annual rainfall has increased at an average rate of 85.6 mm per decade since 1980. [5]
- Singapore’s annual mean temperature rose at 0.24°C per decade over the past 40 years, and could reach 0.55°C per decade by end century under the high emissions scenario. [6]
- Annual mean temperatures are projected to rise 0.6°C to 5.0°C by 2100. [6]
- Under the high emissions scenario, mean daily temperature reaches 30.7°C to 32.9°C by end century. [6]
- Very hot days above 35°C averaged 21.4 days a year over the last 40 years. By end century that becomes 41 to 351 days, depending on emissions. [6]
- Warm nights above 26.3°C averaged 76 a year. Under the high emissions scenario that becomes all 365 nights. [6]
- High heat stress days are projected at 54 to 326 a year by end century. [6]
- Mean sea level around Singapore is projected to rise 0.23 m to 1.15 m by end century. [6]
- Singapore launched its first national Heat Stress Advisory on 24 July 2023, using three levels of risk based on Wet Bulb Globe Temperature. [17]
- The decade 2013 to 2022 was Singapore’s warmest on record. [17]
- A temperature of 37°C was recorded at Ang Mo Kio on 13 May 2023, equalling the record set on 17 April 1983. [17]
- The Heat Stress Advisory launched with readings from a network of nine WBGT sensors across the island. [17]
![Chart 6. Bar. Annual mean temperature for the ten warmest years. Source [5].](https://www.vdairconservices.com/wp-content/uploads/2026/07/06_WAR1-1024x592.png)
Chart 6 data table
| Year | Annual mean (°C) | Year | Annual mean (°C) |
|---|---|---|---|
| 2024 | 28.4 | 2015 | 28.2 |
| 2019 | 28.4 | 1997 | 28.2 |
| 2016 | 28.4 | 2025 | 28.1 |
| 1998 | 28.3 | 2010 | 28.1 |
| 2023 | 28.2 | 2002 | 28.1 |
![Chart 7. Range bar. Days per year above 35°C, observed and projected under three emissions scenarios. Source [6].](https://www.vdairconservices.com/wp-content/uploads/2026/07/07_VER1-1024x592.png)
Chart 7 data table
| Scenario | Very hot days per year |
|---|---|
| Last 40 years (observed) | 21.4 |
| SSP1-2.6 low emissions, by 2100 | 41 to 125 |
| SSP2-4.5 medium emissions, by 2100 | 103 to 261 |
| SSP5-8.5 high emissions, by 2100 | 252 to 351 |
6. Go25 and national cooling policy
Go25 is the clearest policy signal Singapore has sent on how households and offices should use air-conditioning.
- Go25 launched on 16 May 2025, run by the Singapore Green Building Council and the Ministry of Sustainability and the Environment, supported by NEA and BCA. [3]
- A study with Ngee Ann Polytechnic’s Centre for Environmental Sustainability found energy savings of up to 12% for each degree the setpoint was raised from 23°C to 25°C in offices, with no reported increase in occupant discomfort. [3]
- Buildings account for over 20% of Singapore’s carbon emissions. [3]
- Raising the setpoint saves roughly S$6,400 a year for a typical 3,000 square metre office. [18]
- SGBC’s Indoor Comfort Quiz drew over 5,000 responses from Singaporeans. [18]
- 82% of respondents prefer indoor temperatures of 23°C or warmer. [18]
- 43% said they feel uncomfortably cold in offices. [18]
- 39% prefer temperatures around 25°C. [18]
- Only 18% prefer 23°C or colder. [18]
- Nearly 100 organisations had signed the voluntary Go25 Pledge as of the most recent SGBC update. [18]
![Chart 8. Bar. Cooling energy reduction as the setpoint moves from 23°C to 25°C. Source [3].](https://www.vdairconservices.com/wp-content/uploads/2026/07/08_GWP1-1024x592.png)
Chart 8 data table
| Setpoint | Reduction in cooling energy use |
|---|---|
| 23°C | Baseline |
| 24°C | Up to 12% |
| 25°C | Up to 24% |
The 24% figure is the study’s “up to 12% per degree” applied across the full 23°C to 25°C range described in the source. The source states the per-degree figure directly; the cumulative figure is our arithmetic.
7. Green buildings and the cooling standards behind them
- Space cooling is the largest energy consumer in Singapore buildings, at 40% to 60% of a building’s energy consumption. [7]
- The Singapore Green Building Masterplan targets 80% of buildings by gross floor area to be green by 2030. [7]
- It also targets 80% of new developments by GFA to be Super Low Energy from 2030 onwards. [7]
- And 80% improvement in energy efficiency against 2005 levels for best-in-class green buildings by 2030. [7]
- BCA’s Green Mark scheme launched in 2005. [7]
- Under Green Mark 2021, buildings must achieve at least a 50% improvement in energy performance against 2005 levels for certification. [7]
- Green Mark Platinum requires at least a 55% improvement. [7]
- The Super Low Energy programme, introduced in 2018, requires at least a 60% improvement over 2005 building codes. [7]
- Periodic Energy Audits of building cooling systems are conducted every 3 years in new and retrofitted buildings. [7]
- The Mandatory Energy Improvement regime, in force since September 2025, applies to energy-intensive existing buildings with a GFA of 5,000 m² and above. [7]
- Hybrid cooling and passive displacement cooling systems have delivered more than 25% energy savings over conventional air-conditioning systems in Singapore projects. [7]
8. District cooling and the shift away from individual condensers
- SP Group’s Marina Bay network is the world’s largest underground district cooling network. [9]
- Its installed cooling capacity rises by 2,000 refrigeration tons to 75,000 RT by 2027. [9]
- Including new satellite plants, the Marina Bay network will operate at a total capacity of up to 90,000 RT. [9]
- The network has recorded zero supply interruptions since operations began in 2006. [9]
- Subscribers save up to 20% in cooling-related energy consumption. [9]
- The network enables a reduction of 25,000 tonnes of carbon emissions annually for the central district, equivalent to removing 22,700 cars from the roads. [9]
- District cooling reduces total cost of ownership by up to 15% against a conventional in-building chiller. [9]
- By 2027 SP will operate 180,500 RT of cooling capacity through its district cooling networks in Singapore. [9]
- Marina Bay is expanding to 32 buildings by 2027. [19]
- Singapore’s largest industrial district cooling system, at STMicroelectronics in Ang Mo Kio, has a capacity of up to 36,000 RT and cuts carbon emissions by more than 120,000 tonnes annually. [19]
- Tampines Eco Town is Singapore’s first brownfield district cooling project, covering 7 buildings and cutting emissions by more than 1,000 tonnes a year. [19]
- Tengah is Singapore’s first public housing township with a Centralised Cooling System, which uses up to 30% less energy than conventional air-conditioning. [20]
- Approximately 14,000 households across 12 BTO projects in Tengah will have access to the Centralised Cooling System. [20]
- HDB has provided air-conditioner ledges in all Tengah flats for residents who choose their own system instead. [20]
9. Regional cooling demand
These figures are regional or global. They are included for context and labelled accordingly.
- Only 15% of households in Southeast Asia have an air conditioner. (Regional figure.) [21]
- Air-conditioner units in Southeast Asia are projected to rise from 40 million in 2017 to 300 million in 2040. (Regional figure.) [21]
- Electricity demand for space cooling in Southeast Asia grows from 75 TWh in 2017 to 300 TWh in 2040, roughly the combined electricity consumption of Indonesia and Singapore. (Regional figure.) [21]
- Rising cooling demand alone requires around 200 GW of additional generation capacity in the region by 2040. (Regional figure.) [21]
- Cooling could account for as much as 30% of the region’s peak electricity demand. (Regional figure.) [21]
- Only 8% of the three billion people living in the tropics have access to air-conditioning, against over 90% in the United States and Japan. (Global figure. Older data, 2018.) [22]
10. Health, indoor air and maintenance
Singapore-specific health data on air-conditioning is thin. What exists is below, with gaps flagged honestly.
- A blocked condensate tray is a mosquito breeding habitat. From 2020 to October 2023, NEA issued fines to about 22,400 households for mosquito breeding offences. [25]
- NEA took an average of about 5 months to issue a fine after detecting a breeding site over that period. [25]
- Of those 22,400 fines, four (0.02%) were issued to the wrong household because of administrative errors. [25]
- Fires of electrical origin were the second most common cause of residential fires in Singapore in 2025, behind unattended cooking. [23]
- There were 304 residential fires of electrical origin in 2025, up 1.7% on 2024, mostly caused by faults in wiring or appliances or overloaded sockets. [23]
- Residential fires totalled 1,051 in 2025, an 8.6% increase over 2024. [23]
- Fires of electrical origin accounted for 43.5% of fires in non-residential premises in 2025. [23]
- Residential fires as a share of residential dwelling units fell slightly, from 0.067% in 2021 to 0.065% in 2025. [23]
11. Consumer behaviour
- A 1°C rise in ambient temperature increases electricity demand by about 2 kWh a day for households in 5- and 6-room flats, equivalent to running an air-conditioner for two extra hours. (Older data, study period 2012 to 2015.) [22]
- The same 1°C rise increases water use by about 9 litres a day for the average 2-room household, which is roughly an extra shower for every 2.3 households. (Older data.) [22]
- In a 300-person survey of heat relief behaviours, 36% said they would turn on the air-conditioner on a very hot day, against 39% who said they would shower more often and for longer. (Older data, 2018.) [22]
- At the time of that study, fewer than 20% of 2-room apartments had an air-conditioner. By 2023 the figure for HDB 1- and 2-room flats had reached 32.6%. [22][2]
- The electricity demand response to heat among higher-income Singapore households is double the response typically estimated for a United States population in summer. (Older data. Comparison to a global figure.) [22]
FAQ
How much of a Singapore electricity bill is the aircon?
Air-conditioning is nearly a quarter of the average household’s energy consumption, and air-conditioner, fridge, lighting, water heater and washing machine together make up about 80% of it. [3][14]
What temperature should I set my aircon to in Singapore?
The national Go25 movement asks for 25°C or above. The supporting study found up to 12% less cooling energy used for each degree raised from 23°C to 25°C, with no reported increase in discomfort. [3]
Why do all new aircons use R32 instead of R410A?
Because since 1 October 2022 NEA has capped the global warming potential of refrigerants in household split air-conditioners at 750, and R410A sits above that limit. [12]
What does a 5-tick aircon mean?
NEA’s label runs from 1 tick (Low) to 5 ticks (Excellent). The annual energy cost shown on the label assumes 27 cents per kWh and 8 hours of use a day. [11]
Is Singapore actually getting hotter?
Yes. Mean surface air temperature has risen 0.25°C per decade since 1948, about double the global rate, and 2024 tied 2019 and 2016 as the warmest year on record at 28.4°C. [5]
Methodology and about this data
We gathered these figures between 22 and 29 July 2026, working outward from Singapore government primary sources: the Department of Statistics, NEA, EMA, MSS, HDB, SCDF, MSE, NCCS and SP Group. Where a blog or news article pointed to a statistic, we found and opened the original publication before including it, and we cite the original rather than the intermediary.
Every statistic is dated to the year the data refers to, not the year we found it. Anything older than five years is labelled “older data” in the text. Global and regional figures are labelled so they are never mistaken for Singapore data. Where two credible sources disagree, as with market sizing, we present both and say why. Where no credible Singapore data exists for a theme, we list it as a gap in the editor notes rather than fill it with an estimate.
Cite this page
Journalists, researchers and site owners are welcome to use these figures and charts. Please link back to this page so readers can check the sources.
Suggested citation: VD Aircon Services, “133 Singapore Aircon Statistics and Trends for 2026,” July 2026. https://www.vdairconservices.com/singapore-aircon-statistics-trends/
Embed the hero chart:
<a href=”https://www.vdairconservices.com/singapore-aircon-statistics-trends/”>
<img src=”https://www.vdairconservices.com/img/singapore-aircon-ownership-2023.png”
alt=”81.9% of Singapore resident households owned an air-conditioner in 2023″
width=”1200″ height=”675″>
</a>
<p>Source: <a href=”https://www.vdairconservices.com/singapore-aircon-statistics-trends/”>
133 Singapore Aircon Statistics and Trends for 2026, VD Aircon Services</a></p>
All charts on this page are reproducible from the data tables printed beneath them.
Sources
[1] Singapore Department of Statistics, “Ownership/Availability Of Selected Consumer Durables/Service, Quinquennial,” data covering 1973 to 2023, published 2024. https://data.gov.sg/datasets/d_abef8a7f050670891ad530620bad67cb/view
[2] Singapore Department of Statistics, “Report on the Household Expenditure Survey 2023,” 2024. https://www.singstat.gov.sg/files/a8aac6d0-0250-4804-bfb0-3712695cdf24.pdf
[3] Ministry of Sustainability and the Environment, “Launch of Go25 National Movement,” 16 May 2025. https://www.mse.gov.sg/latest-news/launch-of-go25-national-movement/
[4] SP Group, “Electricity Tariff Revision for the Period 1 July to 30 September 2026,” 30 June 2026. https://www.spgroup.com.sg/about-us/media-resources/news-and-media-releases/Electricity-Tariff-Revision-for-the-Period-1-July-to-30-September-2026
[5] Meteorological Service Singapore, “Past Climate Trends,” data to 2025, updated May 2026. https://www.weather.gov.sg/climate-past-climate-trends/
[6] Meteorological Service Singapore and Ministry of Sustainability and the Environment, “Latest Climate Projections For Singapore Show Intensifying Urban Heat And More Wet & Dry Extremes” (Third National Climate Change Study, V3), 5 January 2024. https://www.nea.gov.sg/media/news/news/index/latest-climate-projections-for-singapore-show-intensifying-urban-heat-and-more-wet-dry-extremes
[7] National Climate Change Secretariat, “Buildings,” updated 28 July 2026. https://www.nccs.gov.sg/singapores-climate-action/mitigation-efforts/buildings/
[8] Singapore Department of Statistics, “Resident Households By Type Of Dwelling, Annual,” data to 2025. https://data.gov.sg/datasets/d_edf8bb4773c25dd16b8b6875fd0b52da/view
[9] SP Group, “SP Group Expands Marina Bay District Cooling Network With More Developments And New Satellite Plants,” 26 May 2023. https://www.spgroup.com.sg/about-us/media-resources/news-and-media-releases/SP-Group-Expands-Marina-Bay-District-Cooling-Network-With-More-Developments-And-New-Satellite-Plants
[10] National Environment Agency, “Minimum Energy Performance Standards,” updated 1 July 2026. https://www.nea.gov.sg/our-services/climate-change-energy-efficiency/energy-efficiency/household-sector/minimum-energy-performance-standards
[11] National Environment Agency, “The Energy Label,” updated 1 July 2026. https://www.nea.gov.sg/our-services/climate-change-energy-efficiency/energy-efficiency/household-sector/the-energy-label
[12] National Environment Agency, “Reducing Greenhouse Gas (GHG) emissions from the use of refrigerants in RAC sector,” updated 14 July 2026. https://www.nea.gov.sg/our-services/climate-change-energy-efficiency/climate-change/reducing-ghg-emissions-from-the-use-of-refrigerants-in-rac-sector
[13] Energy Market Authority, “Singapore Energy Statistics 2025, Chapter 3: Energy Consumption,” data for 2024, published October 2025. https://www.ema.gov.sg/resources/singapore-energy-statistics/chapter3
[14] National Environment Agency, “Household Electricity Consumption Profile,” data for 2023, updated 30 July 2025. https://www.nea.gov.sg/our-services/climate-change-energy-efficiency/energy-efficiency/household-sector/household-electricity-consumption-profile
[15] Singapore Department of Statistics, “Electricity Tariff, Monthly” (Low Tension Supplies, Domestic), data to June 2026. https://data.gov.sg/datasets/d_61eac3cdb086814af485dcc682b75ae9/view
[16] SP Group, “Tariff Information,” third quarter 2026. https://www.spgroup.com.sg/our-services/utilities/tariff-information
[17] Ministry of Sustainability and the Environment and National Environment Agency, “New Heat Stress Advisory Launched To Guide Public On Minimising Risk Of Heat-Related Illnesses,” 24 July 2023. https://www.mse.gov.sg/latest-news/press-release-heat-stress-advisory/
[18] Singapore Green Building Council, “Join a growing community of organisations committed to Go 25,” 19 August 2025, updated November 2025. https://www.sgbc.sg/join-go-25-pledgees/
[19] SP Group, “District Cooling & Heating,” 2026. https://www.spgroup.com.sg/sustainable-energy-solutions/district-cooling-and-heating
[20] Housing & Development Board and Keppel Ltd., “HDB awards new Centralised Cooling System contract to Keppel for nine BTO projects in Tengah,” 16 April 2026. https://www.keppel.com/media/hdb-awards-new-centralised-cooling-system-contract-to-keppel-for-nine-bto-projects-in-tengah/
[21] International Energy Agency, “The Future of Cooling in Southeast Asia,” 2019. https://www.iea.org/reports/the-future-of-cooling-in-southeast-asia
[22] National University of Singapore, “NUS study: In response to heat, the more affluent use air-conditioners; low-income households use water,” 21 December 2018, reporting research published in Nature Communications. https://news.nus.edu.sg/nus-study-in-response-to-heat-the-more-affluent-use-air-conditioners-low-income-households-use-water/
[23] Singapore Civil Defence Force, “Emergency Medical Services, Fire & Enforcement Statistics 2025,” February 2026. https://www.scdf.gov.sg/docs/default-source/media-room-(publications)/annual-statistics/scdf-annual-statistics-on-ems-fire-enforcement-2025.pdf
[24] National Environment Agency and PUB, “Eligible Singapore Households Can Claim Up To $400 Climate Vouchers From 15 April 2025,” 15 April 2025. https://www.nea.gov.sg/media/news/news/index/eligible-singapore-households-can-claim-up-to–400-climate-vouchers-from-15-april-2025
[25] Ministry of Sustainability and the Environment, “Oral Reply to Parliamentary Question on Mosquito Breeding Fines by Mr Baey Yam Keng,” 4 October 2023. https://www.mse.gov.sg/latest-news/oral-reply-to-pq-on-mosquito-breeding-fines
[26] TechSci Research, “Singapore Air Conditioner Market, By Region, Competition, Forecast and Opportunities, 2020-2030F,” 2025. https://www.techsciresearch.com/report/singapore-air-conditioner-market/29630.html
[27] Expert Market Research, “Singapore Air Conditioners (AC) Market Report and Forecast 2025-2034,” 2025. https://www.expertmarketresearch.com/reports/singapore-air-conditioners-ac-market
About VD Aircon Services
VD Aircon Services has serviced Singapore homes and businesses since 2016, with over 40,000 units serviced. We are BCA and NEA registered. If you want your system checked, cleaned or replaced with a higher-tick R32 unit, talk to us at vdairconservices.com.

We specialize in Aircon installation, repair, and service. We have all type & model of recon compressor, full set & fancoil. Our technicians are highly proficient in their respective field and repairs and fixes aircon of various brands.